Sales Rep Metrics: Reading Your Own Pipeline
One e-mail is enough. No form, no sign-up.
Online version: https://funneleconomics.ai/solutions/sales-rep
Funnel Economics shows you as a sales rep where you stand with your pipeline, straight from Salesforce. You see which of your deals are too old for their stage and whether your pipeline covers the gap to target. Your win rate across all decided deals is set against the team. Every analysis leads to deals you can act on.
From a real run
- Role
- Sales Rep
- Segment
- New Business
- Run of
Run of 12 October 2026 in a demo org, not a customer result. Last change to any opportunity: 4 October 2026.
Names are replaced by placeholders for publication. “Sales Rep n” and “Opportunity n” are assigned per run; the same number on another page does not necessarily denote the same person or the same deal.
Funnel Economics Strategist is an optional add-on and not active by default.
Overview
Click to enlarge
What you see
- 1.
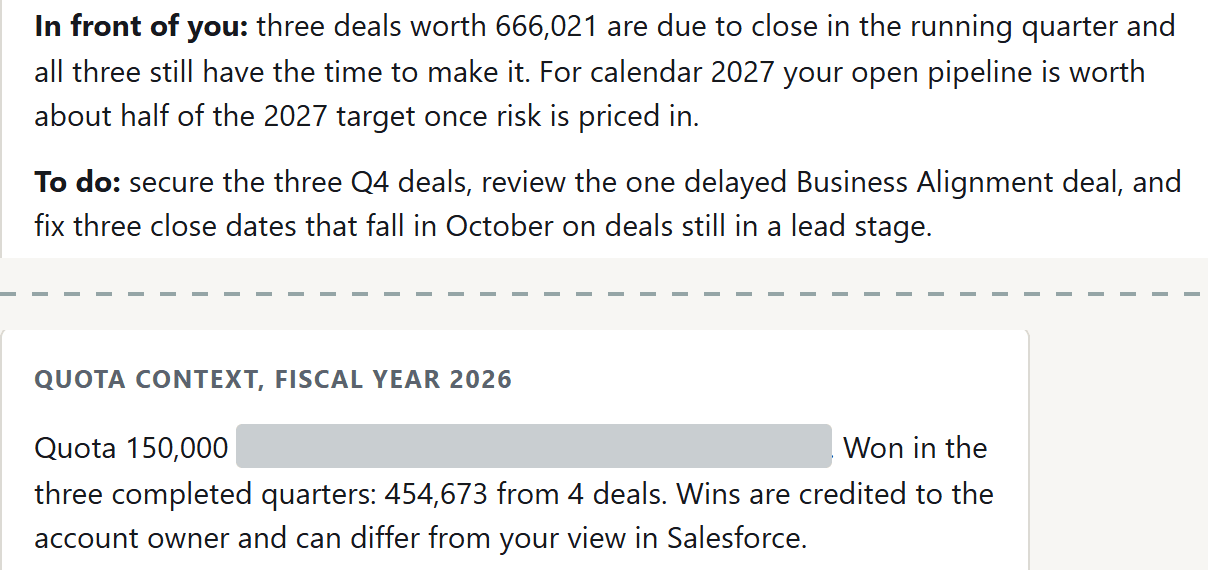
Three of your deals with an amount, 666,021 together, have their close date in the running quarter.
The time the run speaks of runs to the end of the quarter, not to the close date entered for November. For the deal in Negotiation nothing in the stage remains to be run through; only the close is missing.
- 2.
For calendar 2027, your open pipeline carries about half of your 2027 annual quota once risk-weighted.
Risk-adjusted coverage puts rEFV in the place of the open pipeline. The denominator is your 2027 annual quota, not a quarterly target.
- 3.
The run names three tasks: secure the three deals of the quarter, review the delayed deal in Business Alignment, correct three close dates in October.
For sales reps, Strategist is designed to end every analysis with a short, prioritised list of opportunities you can act on directly in Salesforce.
- 4.
Your quota for 2026 is 150,000. In the three completed quarters you won 454,673 from four deals.
The count sets the completed quarters against the annual target. The running quarter is not counted.
- 5.
Wins are credited to the account owner; that can differ from your view in Salesforce.
The analysis credits a win to the owner of the account, not to the owner of the opportunity. Your own list in Salesforce can therefore show different wins.
Trends
Click to enlarge
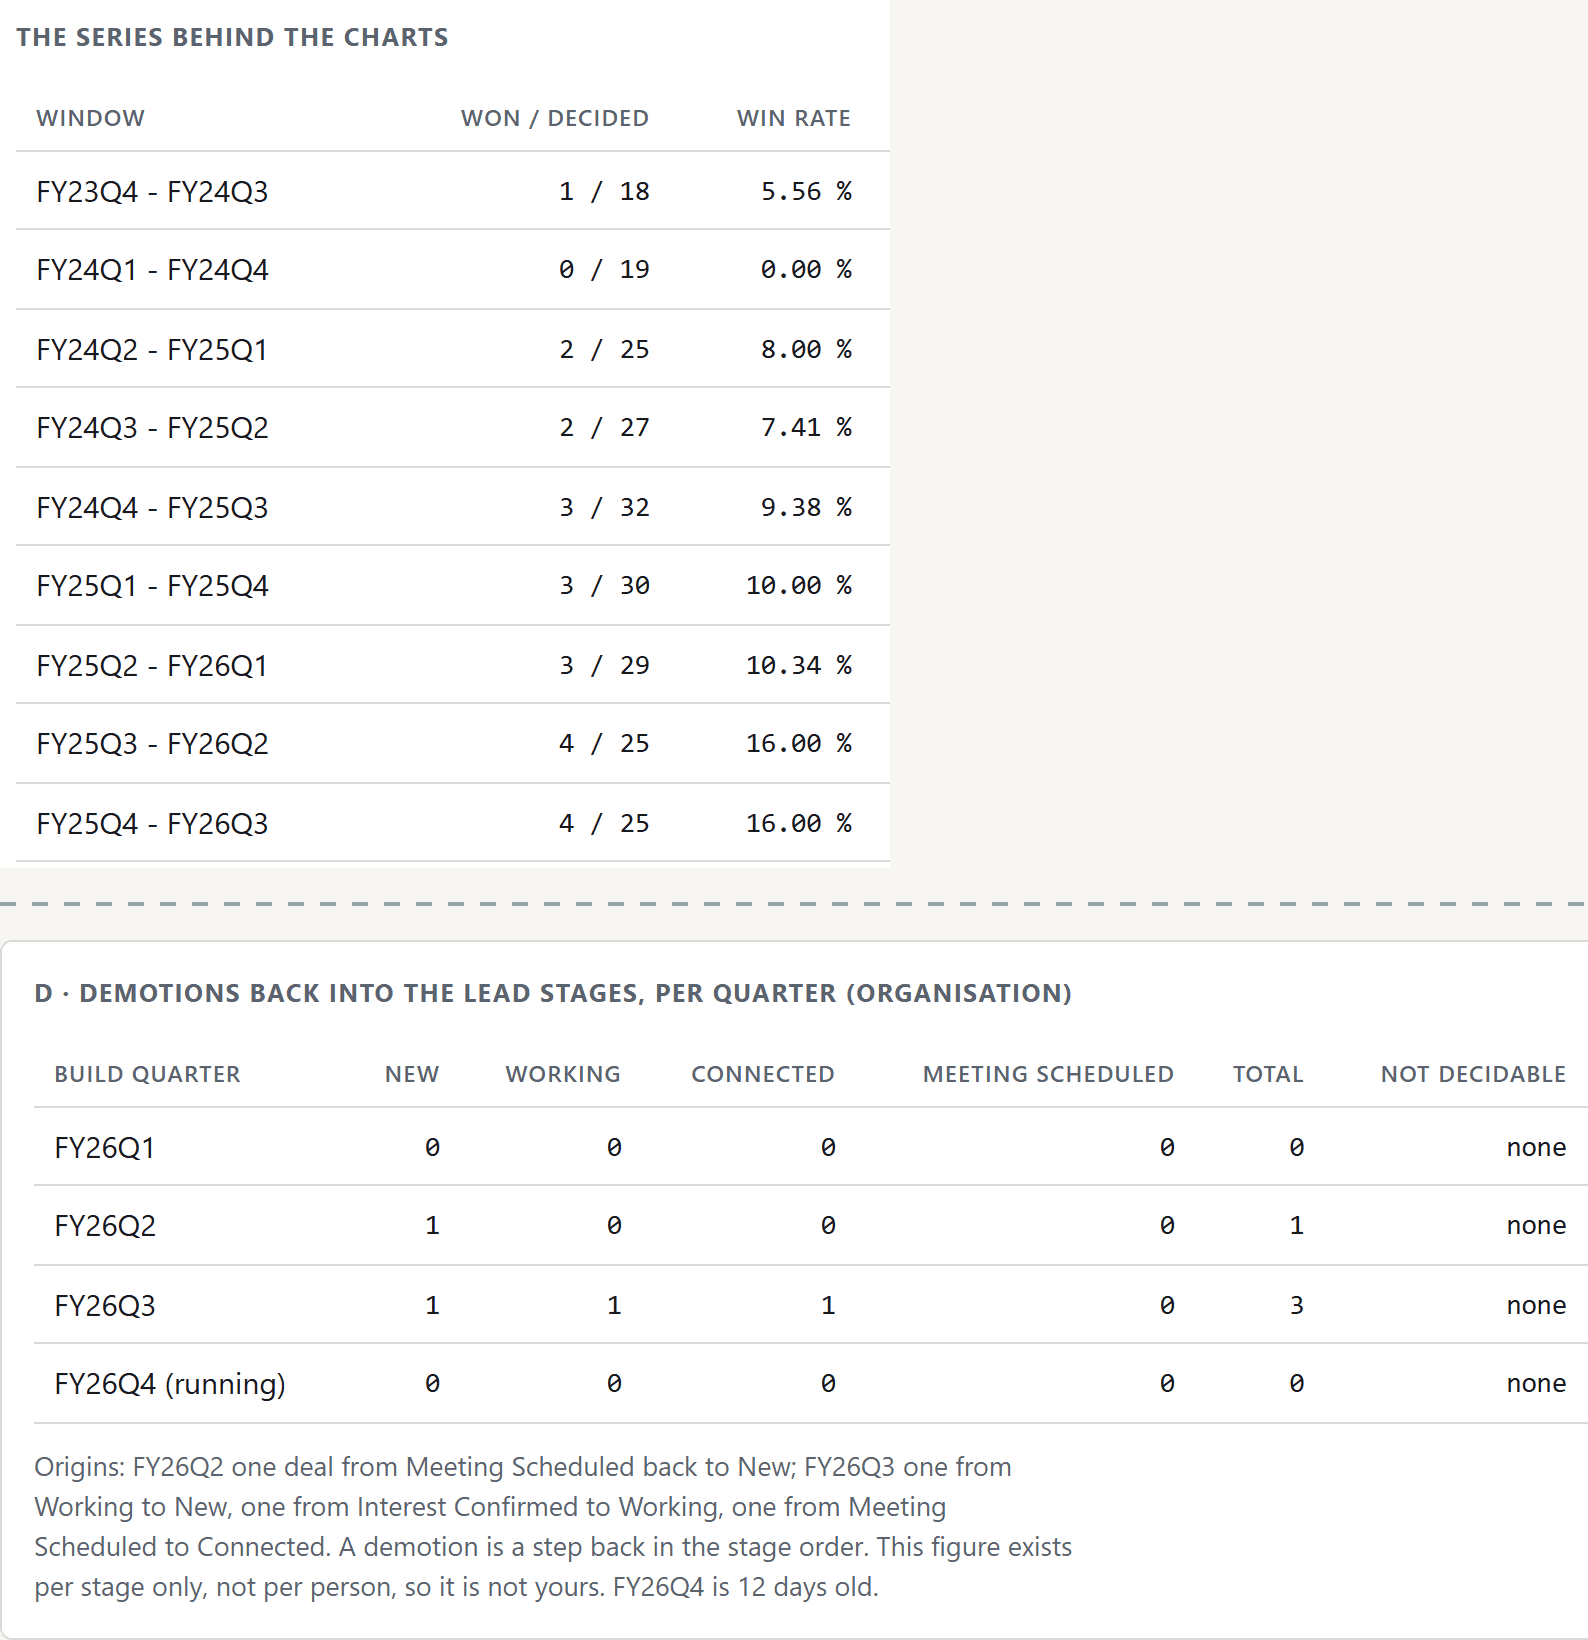
4 of 25
won of decided, rolling window FY25Q4–FY26Q3
What you see
- 1.
In the latest rolling four-quarter window (FY25Q4 to FY26Q3) your win rate on all decided deals stands at 16.0%: four wins from 25 decided deals.
This win rate counts every decided deal, early losses included, and mixes the lead funnel with the opportunity funnel. It is not the win rate on qualified opportunities. The window is not the fiscal year.
- 2.
Nine rows stand for nine overlapping four-quarter windows, each shifted by a quarter.
Each window shares three quarters with its neighbour, so the rise of the series is smoothed. A single win stays visible for four windows.
- 3.
Beside each rate stands its case count; in each period between 18 and 32 of your deals are decided.
A rate is always read with its case count. With so few decisions, a single deal moves the rate noticeably.
- 4.
Across the whole organisation there were three demotions into a lead stage in the third quarter of 2026; the table names the stage each landed in.
A demotion is a step back in the order of stages, a recorded event. The stage history was loaded on 27 September 2026; stage changes after that day are not contained in it.
Sales and Marketing Alignment: Where the Handoff Breaks Down
- 5.
Every row reads “none”: no row was reported as undecidable.
Rows whose direction cannot be decided are reported separately and not counted.
- 6.
The figure exists per stage only, not per person.
It describes the field you work in. It says nothing about your own deals, and it is not a grade.
Details
Click to enlarge
2.87× nominal · 0.52× risk-weighted
What you see
- 1.
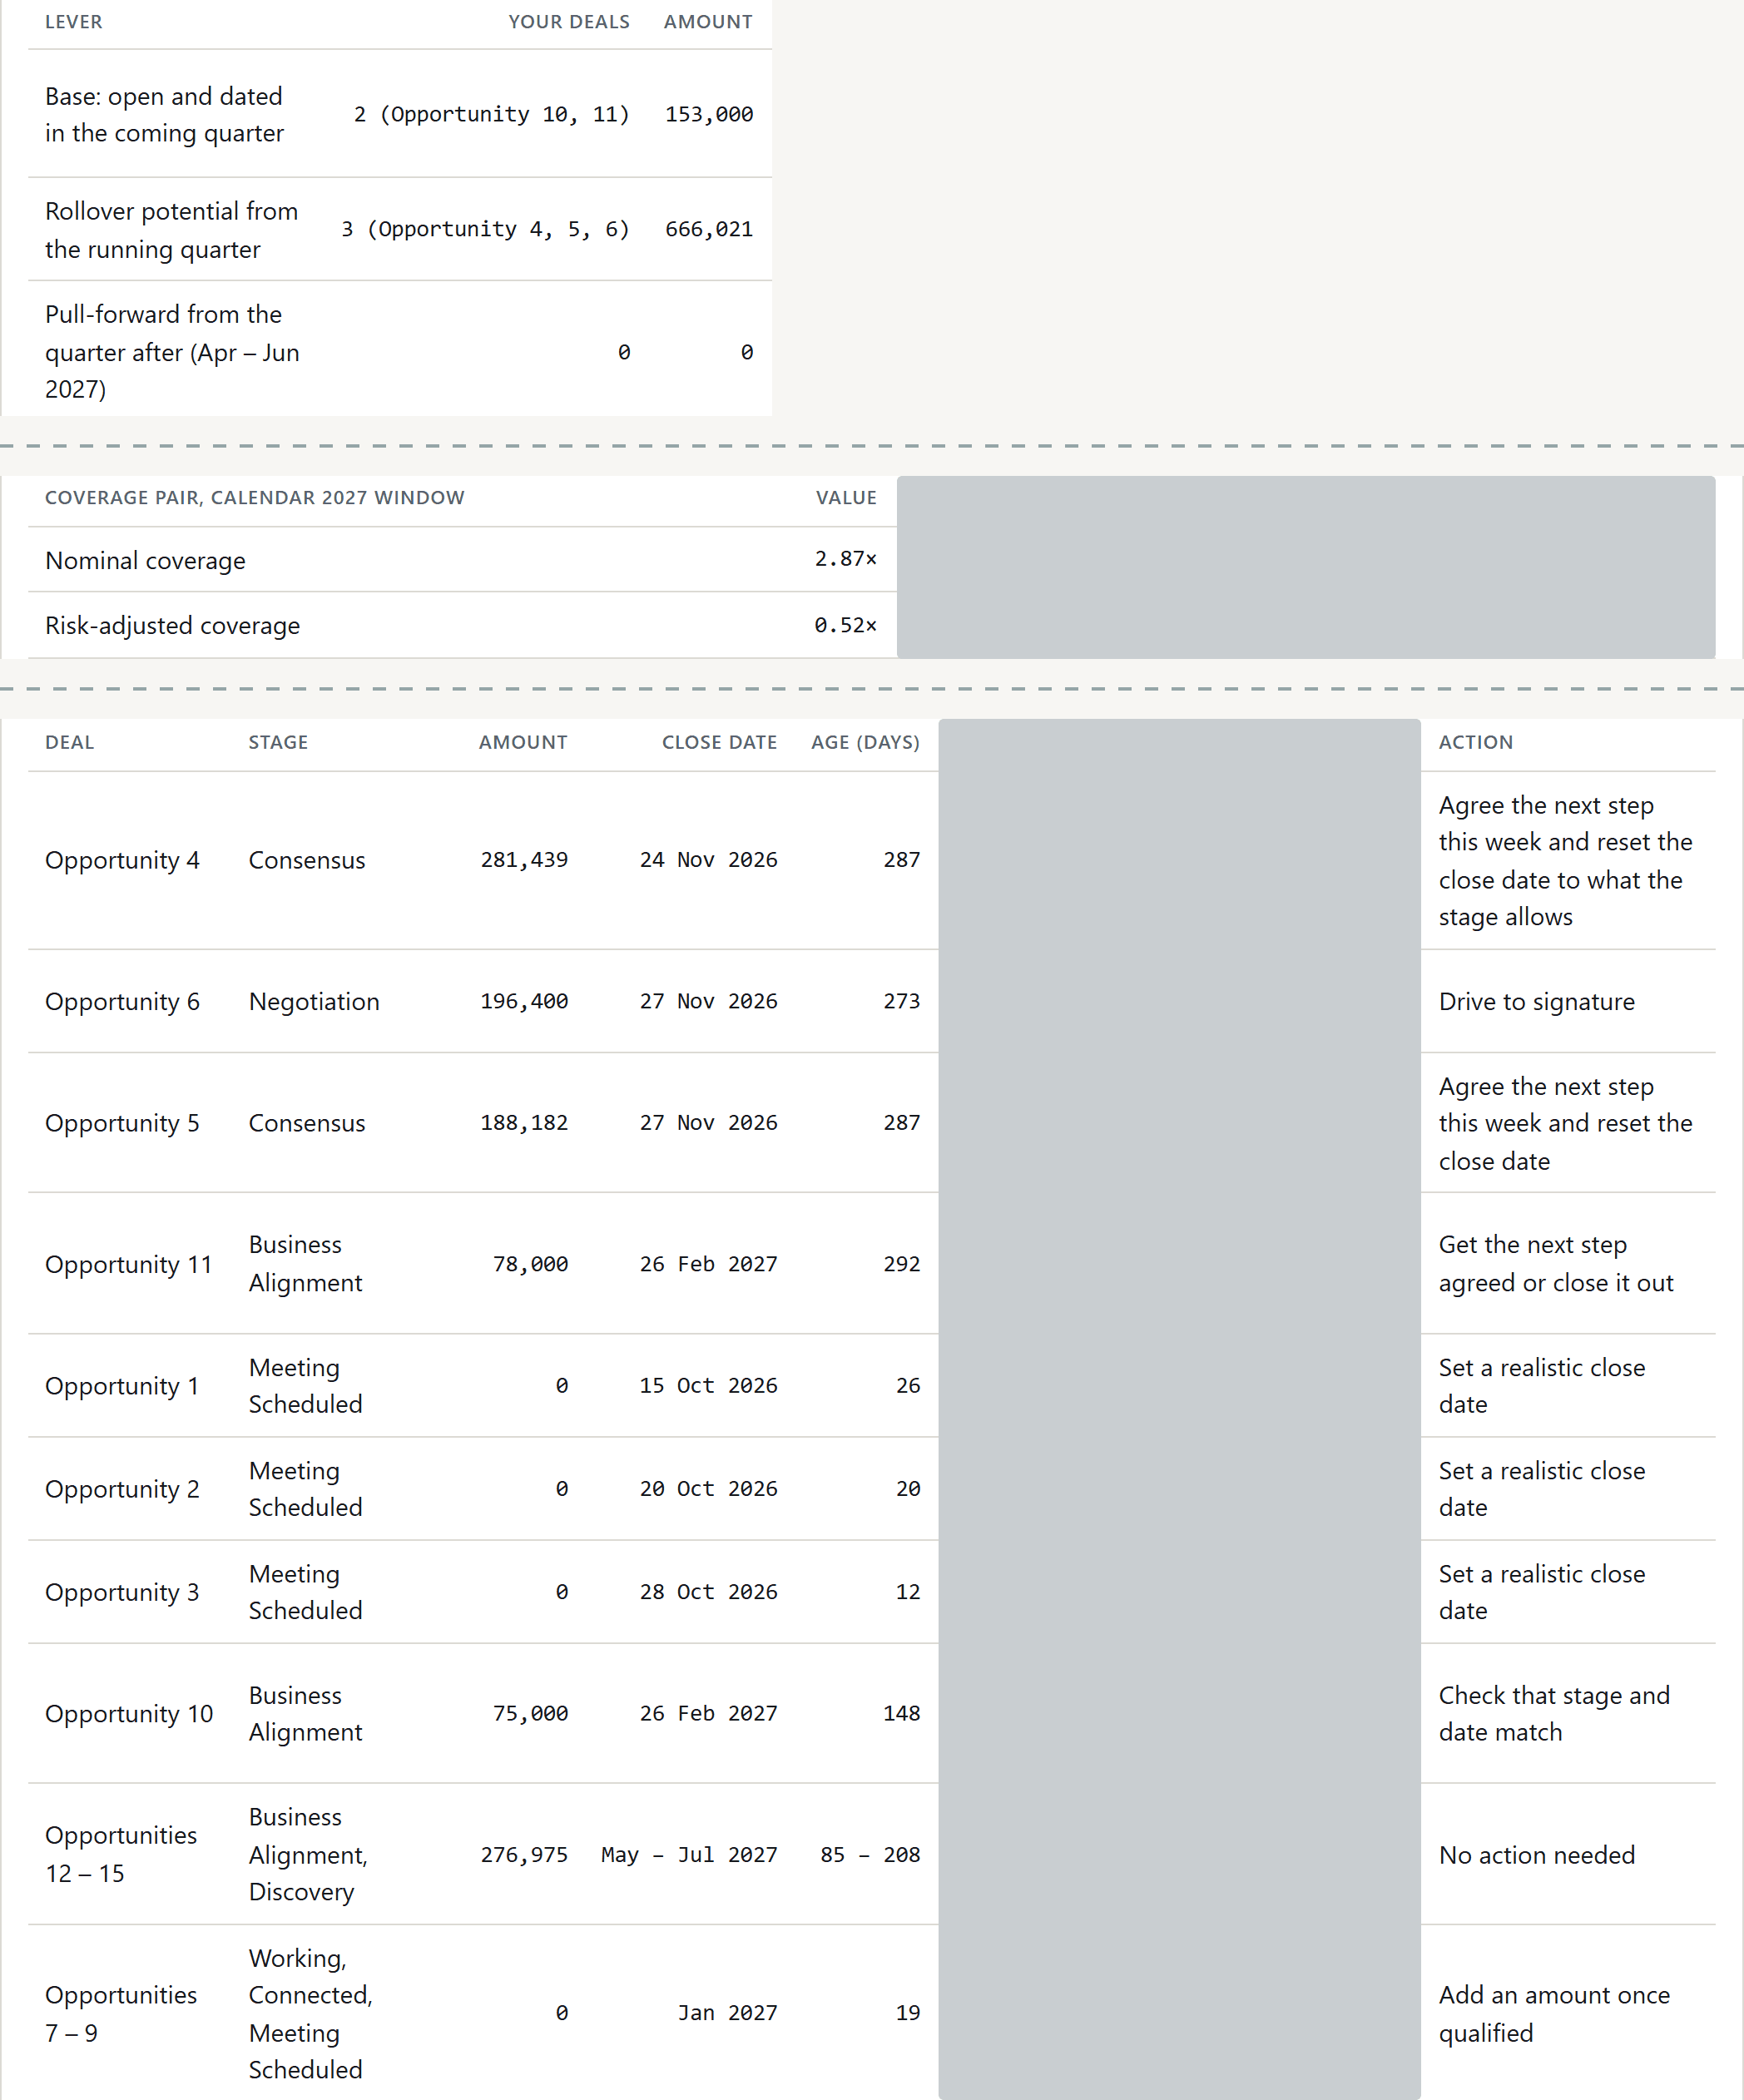
Two of your deals are dated in the coming quarter, 153,000 together.
The amount is the unweighted sum of the two deals. It says how much is dated for the quarter, not how much of it is to be expected; the base of a forecast would be weighted.
- 2.
Three of your deals, 666,021 together, stand as rollover potential from the running quarter.
Potential means deals that are neither won nor lost at the end of the running quarter. The amount is raw, that is, unweighted. It says what could slip over, not that it will. It is not added to the amount of the row above.
- 3.
For pulling forward from the quarter after next, your row shows a zero.
The zero is a result: measured, and nothing found. That is different from “not measured”.
- 4.
Your open pipeline for 2027 is 2.87 times your 2027 annual quota.
Nominal coverage counts every open amount in full. The denominator is your 2027 annual quota.
- 5.
Risk-weighted, it is 0.52 times the same annual quota.
Risk-adjusted coverage puts rEFV in the place of the open pipeline. rEFV weights bEFV by SLA health, with measured factors per band.
- 6.
The table shows two values as a pair: the nominal and the risk-weighted one, both against the same 2027 annual quota.
If only the risk-weighted value is low, pipeline is there but does not carry. If both are low, pipeline is missing.
- 7.
For the three deals with November close dates the list names one action each, for instance: agree the next step this week and adjust the close date.
This is a suggestion of the run, not a rule of the method. Whether a close date is moved is your decision.
- 8.
Opportunity 11 of 78,000 in Business Alignment stands in the DELAYED band; the action: get the next step agreed or close the deal.
The band classifies total age against the two SLA values of the stage. It describes age, not standstill, and is not a verdict on the deal.
- 9.
Three deals in Meeting Scheduled carry a close date in October and no amount.
A deal without an amount adds nothing to any weighted value. The column shows 0; it means no amount is entered, so the value is not measured.
- 10.
For Opportunities 12 to 15 the list says: no action needed.
The list carries all 15 open deals, not only the conspicuous ones. The age assessment is an observation; it removes nothing from any figure.
AI Insights
Click to enlarge
What you see
- 1.
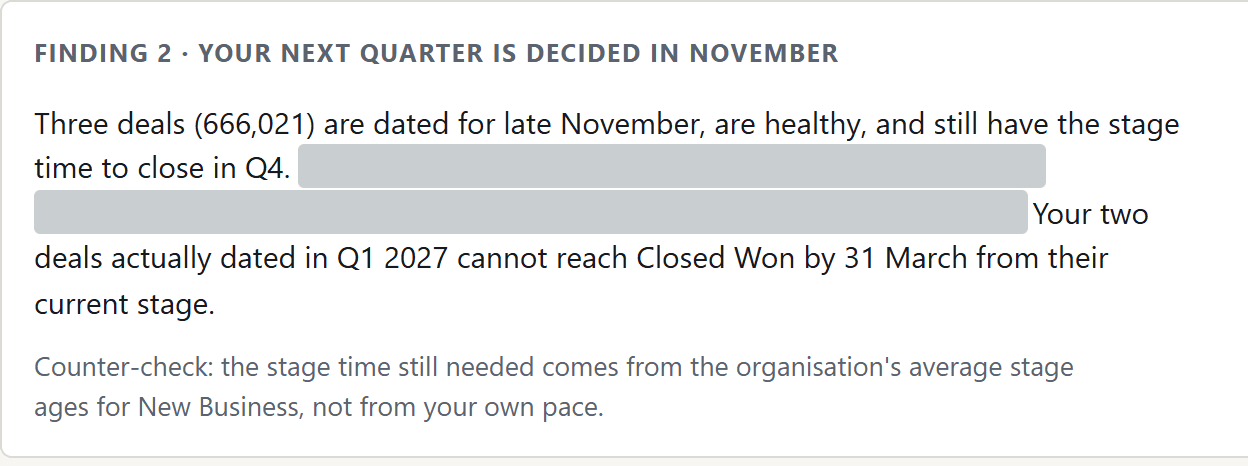
The three deals with close dates in late November stand in the HEALTHY band.
HEALTHY means that the deal’s total age lies within the first SLA value of its stage. The band describes age and is no promise of a close.
- 2.
The run checks itself: the time a stage still needs comes from the organisation’s average stage ages.
Your own pace per stage is not measured in it. The statement that the time is enough holds for the average and to the end of the quarter, not to the close date entered for November.
What Strategist makes of it
- The question
- Where do I stand – and which deals can I act on this week?
- From the answer
The age assessment is an observation and removes nothing from any figure.
- Recommended action
- This week, secure next steps on the three deals with November close dates. For the two Consensus deals, check whether the close dates fit the time their stage still needs by the organisation’s average. Review the delayed deal in Business Alignment: get the next step agreed or close it out. Set realistic close dates on the three deals in Meeting Scheduled.
- What this run does not say
- It computes no personal lever for you: a measured step is missing, and none is invented. The win rate counts all decided deals, not only qualified opportunities. What to expect in the coming quarter cannot be read from it. How many deals slip over has not been measured. The base of a forecast would be weighted; the rollover is a raw amount. The time a stage still needs comes from the organisation’s average stage ages, not from your own pace. Demotions exist per stage only; they are not a statement about you.
The same questions, asked of your pipeline
The run above comes from a demo org. During the beta, your company asks the same questions of its own pipeline, starting in a Salesforce sandbox.
One e-mail is enough. No form, no sign-up.
Which questions do you ask as a sales rep?
The metrics are meant as self-help: they show steps you can take yourself in Salesforce. A deal that is too old for its stage, or a demotion, is feedback, and it protects your own forecast. It is not a reproach. Three questions can be answered with metrics drawn from your own opportunities, the fourth with a count for the whole funnel.
Where do I stand?
The win rate, the share of deals won, is, as the win rate across all decided deals, the share of deals won among the deals decided. CIF, the share of the team's result, measures your share of the deals won and the revenue won by the team in one period. PAS as a combined measure multiplies your win rate across all your decided deals by your CIF.
A figure on its own does not say whether it is good. Your values are therefore set against the team: which quartile you are in by stage win rate and how far away the average of the top quarter is.
If the distance is so small that it does not show a real difference, that is the finding. The team then stands at one level, and the distance is not a personal gap.
A level is not a finding; a movement is. Read the series across several periods before calling a value high or low.
What needs me today?
Your company sets two SLA values per stage and opportunity type. An SLA value is the time target of a stage; what is compared is the deal's total age. SLA Health, a deal's age measured against the SLA, checks that total age for each opportunity in the funnel. That gives each deal its health band: HEALTHY, DELAYED or STALLED.
The deals that are too old for their stage form a prioritised list: the open deals that need your attention now.
The health band is a statement about a deal's total age, not about standstill in one stage. When the share of the DELAYED and STALLED bands rises against the funnel's own history, that is a pattern of its own. It is called funnel calcification, when the conspicuous health bands grow.
Is my pipeline enough for my target?
Coverage belongs on the table as a pair: nominal beside risk-adjusted. Nominal coverage divides your open pipeline by the gap that is still to be closed in the window under review. Risk-adjusted coverage puts rEFV, the risk-adjusted revenue expectation, in the place of the open pipeline.
bEFV, the structural expected value, multiplies each opportunity's amount by its stage win rate. rEFV weights bEFV by SLA Health, with measured factors per band.
A low risk-adjusted value has two opposite causes. If nominal coverage is high, the pipeline is there but does not carry. If nominal coverage is low as well, there is too little pipeline. A clean-up is then the opposite of what helps.
For you, there is only an annual target, no planned target for a single quarter. The gap refers to the window under review and is derived from your annual target.
If your targets are missing from your organisation's plan, no ratio can be formed. That is a finding about planning, not about you.
At the level of the organisation and the region, where a planned target is the denominator, the risk-adjusted value is called HACR, the Health-Adjusted Coverage Ratio.
Where do deals step back into the lead stages?
A demotion is a step back in the stage order. The analysis counts the steps back into the lead stages per stage and for the whole funnel, not per person and not per deal. It describes the field you work in. It is not a grade on your qualification.
Which metrics matter for you?
| Metric | Answers the question | More |
|---|---|---|
| Win rate | How often do I win among all decided deals? | Win rate in the glossary |
| PAS | How do my win rate across all decided deals and my contribution stand together? | PAS in the glossary |
| CIF | What share of the team's result do I carry? | CIF in the glossary |
| bEFV | What is my open pipeline worth at your own stage win rates? | bEFV in the glossary |
| rEFV | What can be expected once SLA Health is factored in? | rEFV in the glossary |
| Coverage as a pair | Does my pipeline cover the gap to target, nominally and risk-adjusted? | HACR in the glossary, for organisation and region |
| SLA Health | Which of my deals are too old for their stage? | SLA Health in the glossary |
Low coverage has two causes: too little pipeline, or pipeline that does not carry. Nominal coverage beside it shows which one it is.
How to get started
Funnel Economics is entering its beta phase. During the beta, your company starts by running it against a Salesforce sandbox.
Funnel Economics Core is a managed package that runs in your Salesforce org. The prerequisite is Salesforce Enterprise Edition; Data Cloud is not required. There, Core calculates bEFV and a simplified rEFV by health status.
Core ships with dashboards. Among other things, they show how the open deals spread across HEALTHY, DELAYED and STALLED, as a share and as an amount. The dashboards include a personal pipeline view for sales reps.
For dashboard commentary, Core can call a language model. This AI data transfer is off by default and is enabled per org and per user; the package masks personal values before the call.
Funnel Economics Strategist is an optional add-on and not active by default. Strategist requires a per-user authorisation that your Salesforce administrator controls and can revoke. The prepared context then passes through a service we operate to your company's chosen language model, with the names of sales reps and opportunities and record links. That includes your name.
The language model processes the data under your company's agreement with the provider. We strongly recommend securing the use of Strategist with an enterprise agreement with that provider, including a data-processing agreement that excludes the use of the data for training. That is a recommendation, not a precondition.
The comparison with the team, coverage as a pair, the prioritised list and demotions per lead stage for the whole funnel are delivered by Strategist. For sales reps, Strategist is designed to end every analysis with a short, prioritised list of opportunities you can act on directly in Salesforce.
Discover is meant for trying Funnel Economics before any installation. It is built on a demo org.
What it looks like in the dashboard
This page describes how to read the metrics in your role. Anonymised examples of the dashboards are on the platform page.
Related terms
FAQ
What are good metrics for a sales rep?
That depends on your question. Win rate across all decided deals, PAS and CIF, set against the team, show where you stand. SLA Health with its health bands shows which deals need attention now. Nominal and risk-adjusted coverage, as a pair, show whether your pipeline covers the gap to your target. All of these sales rep metrics are calculated from the opportunities in Salesforce.
How can I tell which of my deals need attention now?
By the health band. Your company sets two SLA values per stage and opportunity type. An SLA value is the time target of a stage; what is compared is the deal's total age. SLA Health places each deal as HEALTHY, DELAYED or STALLED. The deals that are too old for their stage form a prioritised list. Such a deal is feedback, not a reproach.
Is my pipeline enough to hit my quota?
Coverage as a pair shows that. Nominal coverage divides your open pipeline by the gap that remains in the window under review. Risk-adjusted coverage puts rEFV in the place of the open pipeline. If only the risk-adjusted value is low, the pipeline is there but does not carry. If both are low, there is too little pipeline. For you, there is only an annual target; the gap is derived from it for the window. If your targets are missing from your organisation's plan, no ratio can be formed.
Where does Funnel Economics Core calculate, and what leaves Salesforce in the process?
Funnel Economics Core calculates in your Salesforce org. For dashboard commentary, Core can call a language model. This AI data transfer is off by default and is enabled per org and per user; the package masks personal values before the call.
What leaves Salesforce when Strategist is active?
Strategist is an optional add-on. The prepared context passes through a service we operate to your company's chosen language model. Rep names, opportunity names and record links go along by design: an answer with placeholders would be useless. Our leg requires a data-processing agreement, which we are preparing. The language model processes the data under your company's agreement with its provider. There we strongly recommend an enterprise agreement with a data-processing agreement that excludes training use; a recommendation, not a precondition. Your Salesforce administrator controls and can revoke per-user authorisation.
What does Core calculate, and what does Strategist calculate?
Funnel Economics Core calculates bEFV and a simplified rEFV by health status in your Salesforce org and shows both in the dashboards. Funnel Economics Strategist forms rEFV with measured factors per health band; further figures build on that, such as cEFV as the best case of the forecast range.