Sales Pipeline Metrics for RevOps: One Number per Stage
One e-mail is enough. No form, no sign-up.
Online version: https://funneleconomics.ai/solutions/revops
Funnel Economics gives RevOps sales pipeline metrics that can be checked for every stage, straight from Salesforce. They show which opportunities are older than intended, how much pipeline value is tied up in them and what expected value follows. The basis is your own historical stage win rates and the SLAs you set per stage – not estimates from forecast calls.
Which questions does RevOps ask?
RevOps supplies the numbers that sales, marketing and the executive team rely on. Five questions keep coming back. Each has a metric that can be checked against your own data.
Which deals are older than intended, and in which stage?
An SLA value is the time target of a stage; what is compared is the deal's total age. You set two values for it per stage and opportunity type. SLA Health compares each opportunity's total age in the funnel with them and classifies it as HEALTHY, DELAYED or STALLED.
BPV, the deviation from the SLA per stage, shows by what percentage the time spent in a stage deviates from the SLA. When the share of the DELAYED and STALLED bands rises against the funnel's own history, that is a pattern of its own. It is called funnel calcification, when the conspicuous health bands grow.
What is the pipeline worth?
The sum of open deals says little about the value of the pipeline. bEFV, the structural expected value, multiplies each opportunity's amount by its stage win rate. The stage win rates come from your own past, per sales rep, opportunity type and stage.
rEFV, the risk-adjusted revenue expectation, additionally weights bEFV by SLA Health, with measured factors per band. EVL, the distance between bEFV and rEFV, is the distance between two expected values, expressed in euros, not a lost amount. EFV Density, a term of the method for pipeline quality, sets rEFV in relation to total pipeline volume. No tool reports EFV Density.
Is the handoff from marketing to sales stuck?
Between marketing and sales lie handoff stages. How to check the handoff is described in the article on where leads get stuck between marketing and sales.
Does a drop come from individual teams or from all of them?
When the stage win rate of a stage falls, the location matters. Is the drop local, with individual sales reps or regions, or does it affect the majority of teams and regions? The second case is described in the article on global stage attrition, when the stage win rate drops across most teams.
Two metrics compare individual sales reps. CIF, the share of the team's result, measures a rep's share of the deals won and the revenue won. PAS as a combined measure multiplies a sales rep's win rate across all their decided deals by their CIF.
Does the forecast hold?
cEFV, the calibrated revenue forecast, refers to the end of the period and is the best case of the forecast range, not the realistic case. cEFV is calculated by the optional add-on Funnel Economics Strategist. Strategist is designed to give a forecast as a range of three named cases; in the running quarter, as three standings.
EFV Ratio as the check of forecast against result divides, after the fact, the revenue won by the rEFV at the start of the period. It says how well the forecast was calibrated, nothing about target attainment; it can stand beside a missed plan.
Which metrics matter for RevOps?
The table assigns each question its metric.
| Metric | Answers the question | More |
|---|---|---|
| BPV | In which stage does it take longer than intended? | BPV in the glossary |
| bEFV | What is the pipeline worth at your own stage win rates? | bEFV in the glossary |
| rEFV | What expectation follows once SLA Health is factored in? | rEFV in the glossary |
| EVL | How large is the distance between bEFV and rEFV? | EVL in the glossary |
| cEFV | What revenue does the best case of the forecast range name for the end of the period? | cEFV in the glossary |
| EFV Ratio | How does the result relate to the rEFV at the start of the period (actual ÷ rEFV)? | EFV Ratio in the glossary |
| CIF | What share of the team's result does a sales rep carry? | CIF in the glossary |
| PAS | How do a sales rep's win rate across all decided deals and contribution stand together? | PAS in the glossary |
RevOps does not have to collect opinions: every stage carries a number that can be checked against your own data.
How to get started
Funnel Economics is entering its beta phase. During the beta, you start by running it against a Salesforce sandbox.
Funnel Economics Core is a managed package that runs in your Salesforce org. The prerequisite is Salesforce Enterprise Edition; Data Cloud is not required. There, Core calculates bEFV and a simplified rEFV by health status.
Core ships with dashboards. Among other things, they show how the open deals spread across HEALTHY, DELAYED and STALLED, as a share and as an amount.
You set the SLA values yourself: two values per stage and opportunity type. Funnel Economics Core calculates the stage win rates in the background from your completed periods.
Funnel Economics Strategist is an optional add-on and not active by default. Strategist requires a per-user authorisation that your Salesforce administrator controls and can revoke. The prepared context then passes through a service we operate to the language model you have chosen, with the names of sales reps and opportunities and record links.
The language model processes the data under your own agreement with the provider. We strongly recommend securing the use of Strategist with an enterprise agreement with that provider, including a data-processing agreement that excludes the use of the data for training. That is a recommendation, not a precondition.
Discover is meant for running through the questions of your role before any installation. It is built on a demo org.
What it looks like in the dashboard
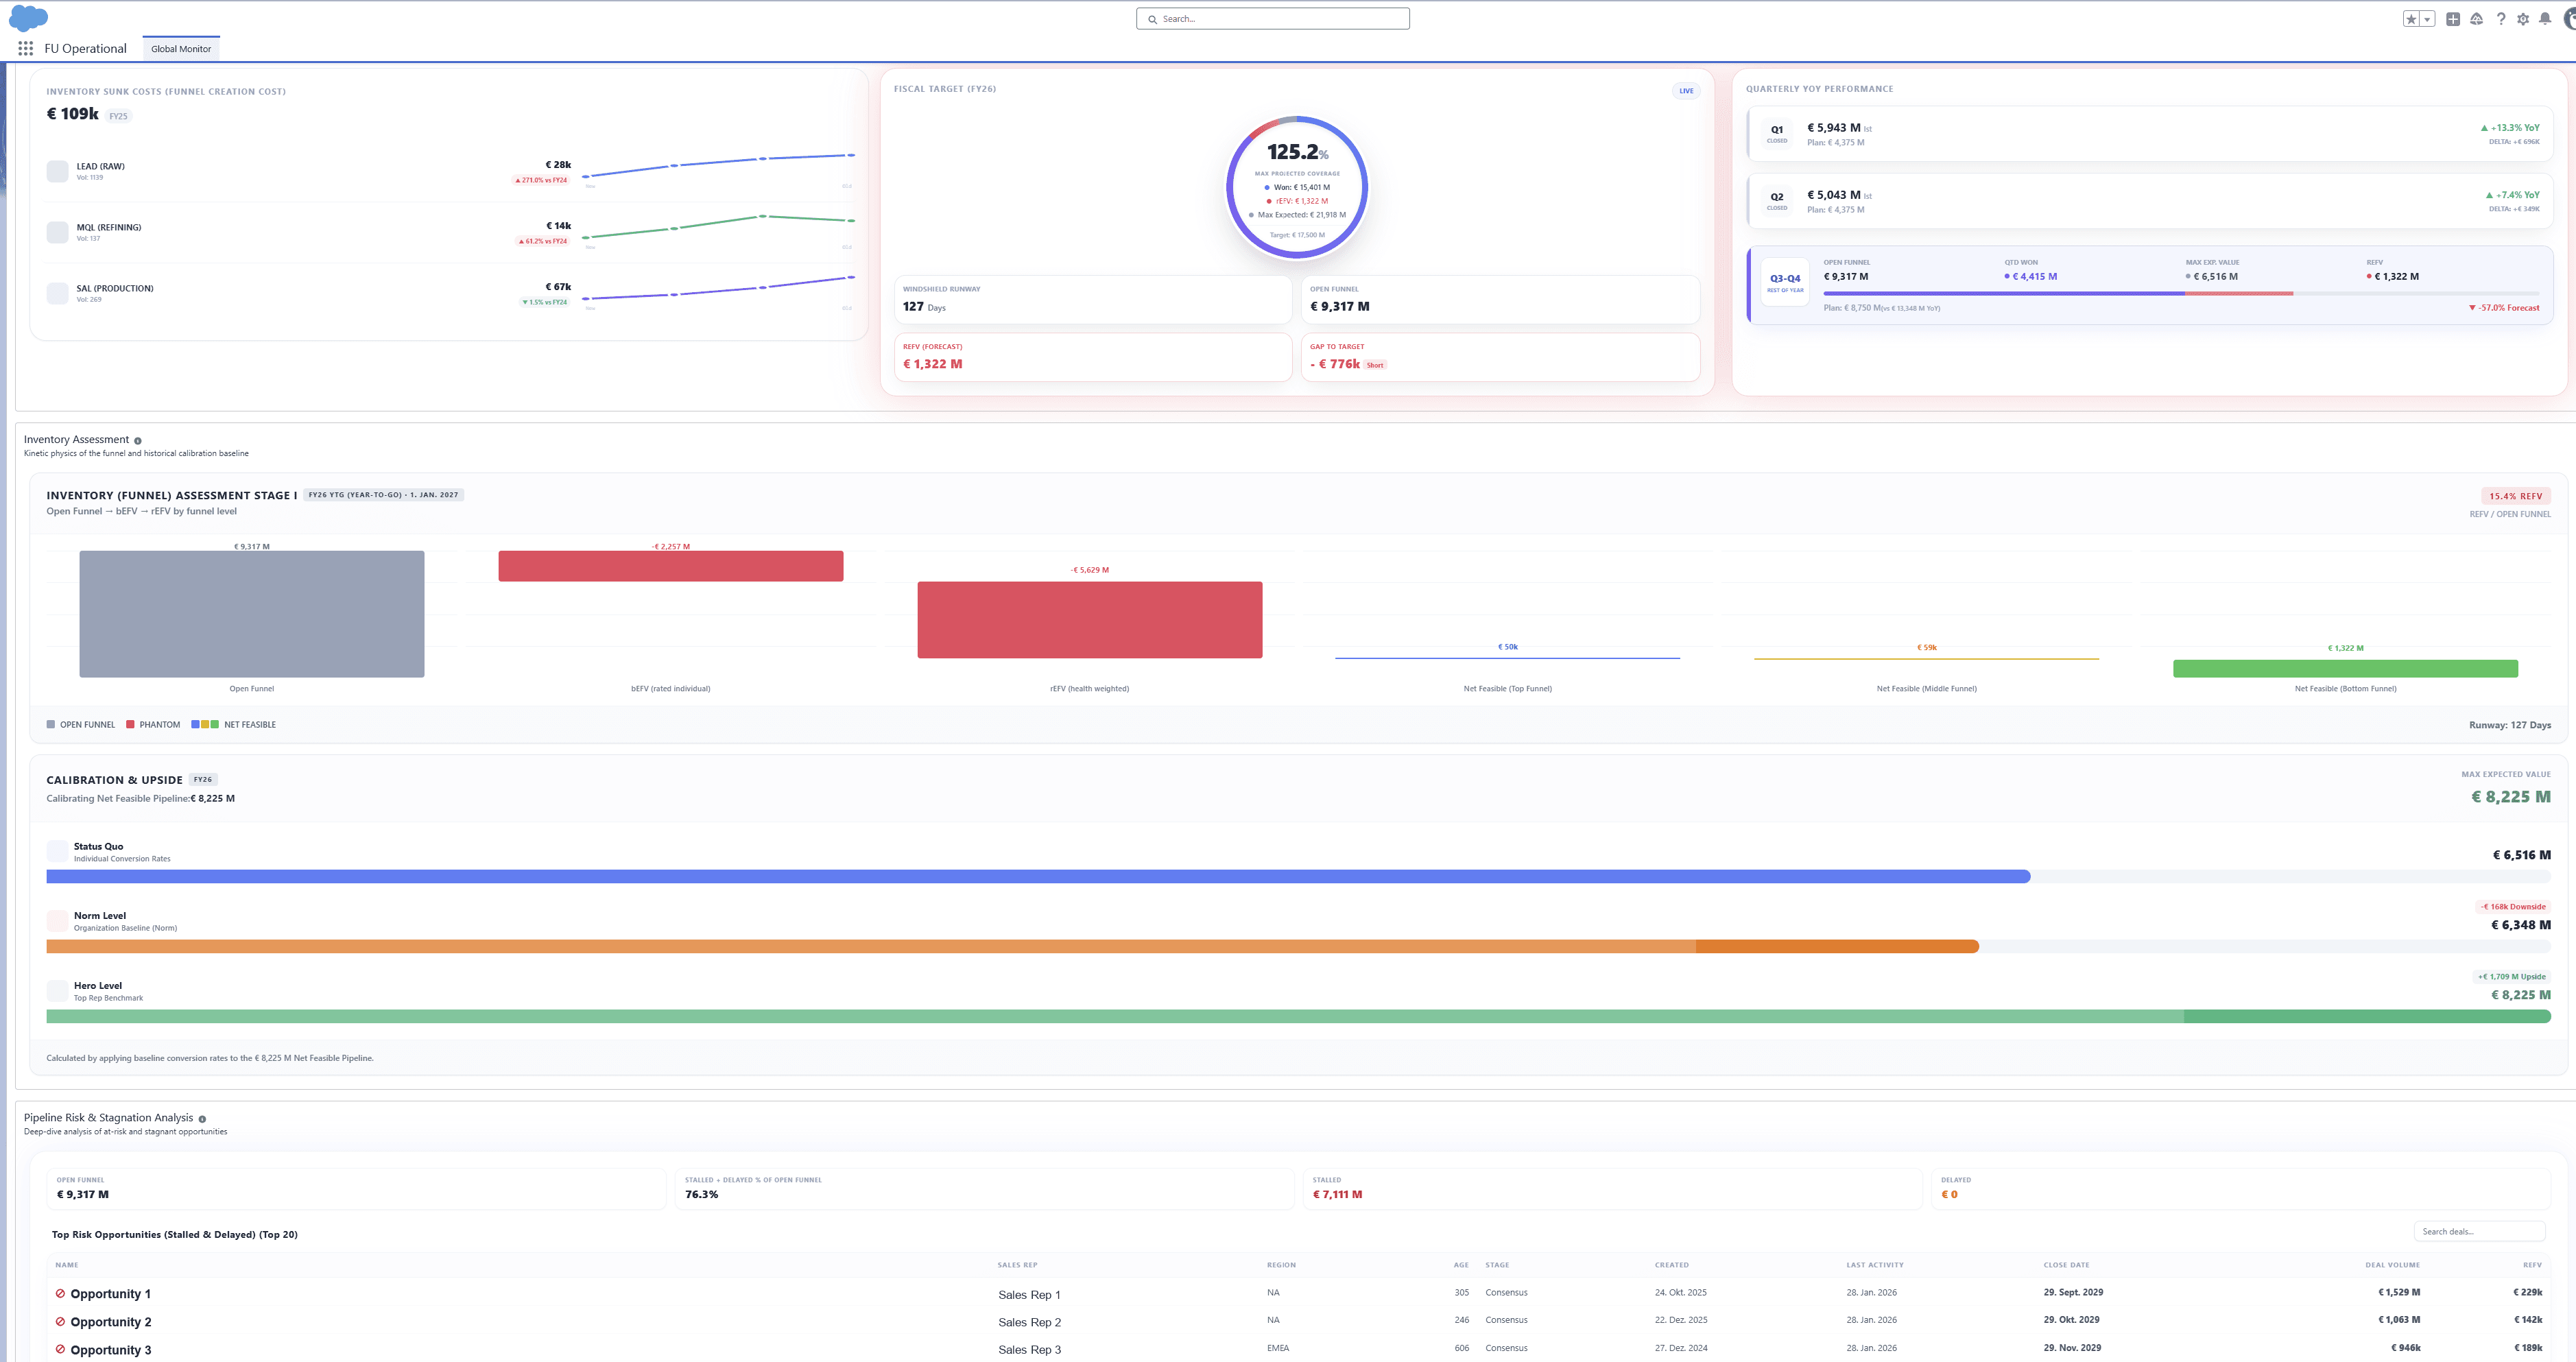
The screenshot shows an anonymised example of the Funnel Economics dashboards. This page only describes how to read the metrics in your role.
Related terms
FAQ
What are pipeline metrics?
Pipeline metrics are numbers that describe the open deals of a sales organisation. Which ones matter depends on the question. For deals older than intended and their stage, they are SLA Health and BPV. For what the pipeline is worth, they are bEFV, rEFV and EVL. For the forecast, they are cEFV and EFV Ratio; for comparing sales reps, CIF and PAS. Core calculates bEFV, a simplified rEFV and EVL in your Salesforce org; the optional add-on Strategist calculates rEFV with measured factors per band, cEFV and BPV.
How does Funnel Economics relate to Salesforce forecasting?
The forecast range consists of three named cases: worst case, realistic case and best case. Each case stands for an assumption about the business, not a confidence bound. cEFV, the calibrated revenue forecast, is the best case, not the realistic case. The optional add-on Funnel Economics Strategist calculates it and is designed to give this range for a window not yet begun. The running quarter gets three standings: won so far, expected (an upper bound) and the bound of today's stock – everything open today won, no absolute ceiling.
Where does Funnel Economics Core calculate, and what leaves Salesforce in the process?
Funnel Economics Core calculates in your Salesforce org. For dashboard commentary, Core can call a language model. This AI data transfer is off by default and is enabled per org and per user; the package masks personal values before the call.
What leaves Salesforce when Strategist is active?
Funnel Economics Strategist is an optional add-on. The prepared context passes through a service we operate to your chosen language model. Rep names, opportunity names and record links go along by design: an answer with placeholders would be useless. Our leg requires a data-processing agreement, which we are preparing. The language model processes the data under your agreement with its provider. There we strongly recommend an enterprise agreement with a data-processing agreement that excludes training use; a recommendation, not a precondition. Your Salesforce administrator controls and can revoke per-user authorisation.
What does Core calculate, and what does Strategist calculate?
Funnel Economics Core calculates bEFV and a simplified rEFV by health status in your Salesforce org and shows both in the dashboards. Funnel Economics Strategist calculates rEFV with measured factors per health band; further figures such as cEFV build on that. Strategist also calculates BPV.