Pipeline Review for CROs: The Numbers Behind the Forecast
One e-mail is enough. No form, no sign-up.
Online version: https://funneleconomics.ai/solutions/cro
Funnel Economics gives CROs the numbers for the pipeline review, straight from Salesforce. They show what the open pipeline lets you expect at your own stage win rates and whether it covers the gap to target. They show in which stage deals are too old and which sales reps carry the revenue. Each metric is read against its own history.
From a real run
- Role
- CRO
- Segment
- New Business
- Run of
Run of 11 October 2026 in a demo org, not a customer result. Last change to any opportunity: 4 October 2026.
Names are replaced by placeholders for publication. “Sales Rep n” and “Opportunity n” are assigned per run; the same number on another page does not necessarily denote the same person or the same deal.
Funnel Economics Strategist is an optional add-on and not active by default.
Overview
Click to enlarge
What you see
- 1.
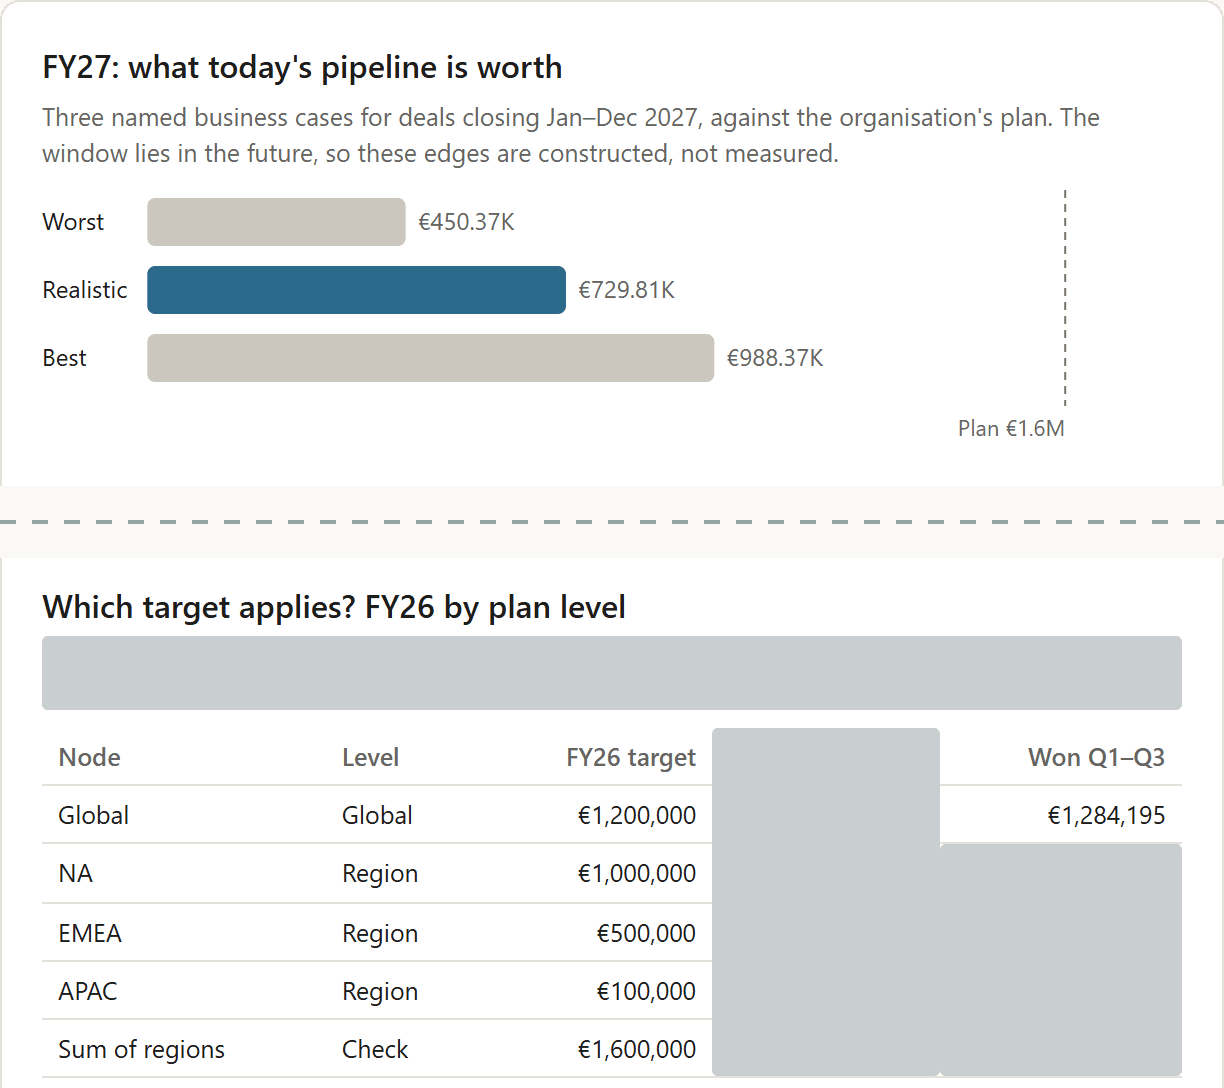
For the deals due to close in 2027, the worst case stands at €450.37K.
The worst case counts only today's stock, weighted by the measured factor of each health band: no deal grows, none arrives. It is a business assumption, not a lower bound.
- 2.
The realistic case stands at €729.81K, the best case at €988.37K.
A forecast for executives is a range of three named cases. The window lies in the future; the edges are constructed, not measured.
- 3.
The plan of €1.6M lies to the right of all three bars.
The edges of the range are assumptions, not limits. The plan lies outside them; whether it is reachable, the range does not say.
- 4.
The organisation has an annual target of €1,200,000 and won €1,284,195 in the three completed quarters.
Quota attainment is revenue won against the target of the same level. The organisation is held against its own annual plan; here the completed quarters count, without the running one.
- 5.
Each of the three regions carries its own annual target: €1,000,000, €500,000 and €100,000.
Each level is read against its own target: organisation, region or sales rep. What the single region has won, this run does not measure.
- 6.
The regional targets add up to €1,600,000, more than the organisation's target; the table carries the row as a check, not as a level.
The sum of the regions is not a second target of the organisation. That the levels do not add up is a finding about the plan and often intended.
Trends
Click to enlarge
€5.5M
open pipeline today
What you see
- 1.
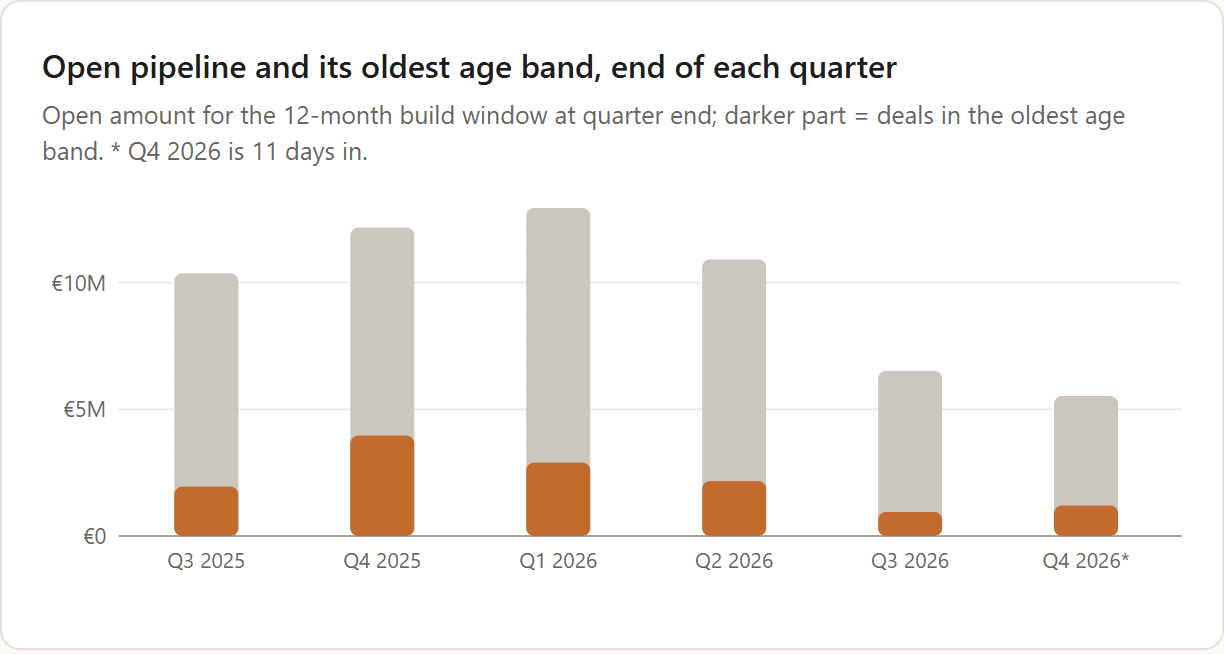
The open amount for the next twelve months was highest at the end of the first quarter of 2026, at €12.9M.
This is the forward view: the stock the coming periods have to be won from. Open deals count here at their full amount.
- 2.
€5.5M stands today; the last bar carries an asterisk because the quarter is only eleven days old.
What is read is the movement against the organisation's own prior quarters, not the single level. The twelve-month windows overlap; neighbouring bars are not independent observations.
- 3.
The dark part of each bar shows the amount of the deals in the oldest band.
A health band classifies total age against the two SLA values of the stage. It describes age, not standstill, and is not a verdict that these deals are lost.
Details
Click to enlarge
14
promotions, third quarter
What you see
- 1.
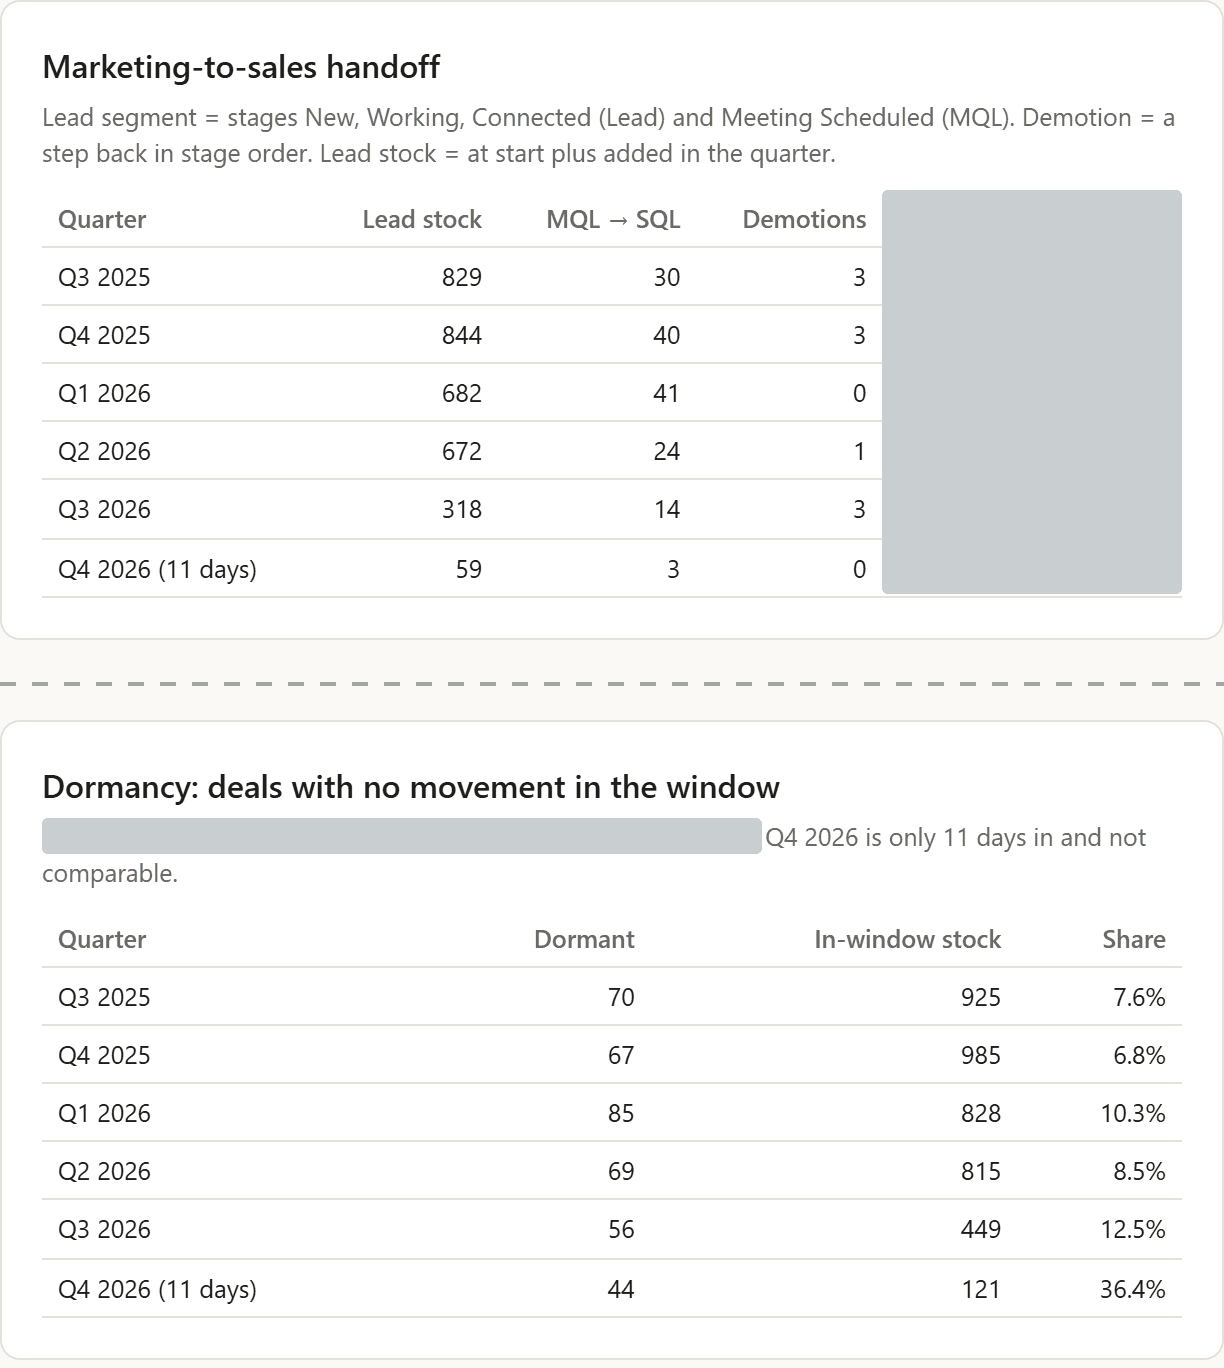
Promotions out of the last lead stage stood at 30 and 40 in the second half of 2025, at 41 in the first quarter of 2026, and then fell to 24 and 14.
For CROs, Strategist is designed to direct attention to the interfaces between stages and between marketing and sales, and to propose concrete measures. The series is read against the organisation's own prior quarters. The table stands on the stage history as loaded on 27 September 2026; movements after that are missing.
- 2.
Demotions into a lead stage numbered zero to three per quarter, against a lead stock of 318 to 844.
A demotion is a step back in the order of stages, a recorded event. The excerpt does not show whether every row could be decided; the figure holds only with that basis.
Sales and Marketing Alignment: Where the Handoff Breaks Down
- 3.
The last row stands for the running quarter and is marked “11 days”.
The value is provisional; the quarter is still open. No opportunity has changed since 4 October.
- 4.
In the third quarter of 2026, 56 of 449 deals in the stock were dormant, 12.5%; in the third quarter of 2025 it was 7.6%.
Dormant Opportunities are open opportunities that show not a single movement during an entire period. The quantity is never stated without the length of its period. The table stands on the stage history of 27 September 2026; movements after that are missing, and the share describes the standing of that day.
- 5.
From the fourth quarter of 2025 to the third of 2026, dormant deals fell from 67 to 56, the in-window stock from 985 to 449. The share of dormant deals rose from 6.8% in the fourth quarter of 2025 to 12.5%.
Count and share are two statements: the count fell here, the share rose. Whoever names one of them names the stock it refers to with it.
- 6.
For the running quarter a much higher share is shown, marked “11 days”.
The window is only eleven days long, and no opportunity has changed since 4 October. The value is not comparable with the completed quarters.
What Strategist makes of it
- The question
- Does the pipeline carry next year – and at which interface of the funnel is that decided?
- From the answer
The open question is FY27.
- Recommended action
- Go through the largest deals due in the running quarter one by one. Check the 2027 pipeline per sales rep against the respective target. Clarify whether the gap between the total plan and the regional plans is intended.
- What this run does not say
- It names no cost per euro won: the organisation has no unit costs on file. The range for 2027 is constructed; for this window there is no outcome yet to measure it against. No opportunity has changed since 4 October; the empty start of the quarter therefore partly reflects the data, not only the business. It makes no comparison with the market.
The same questions, asked of your pipeline
The run above comes from a demo org. During the beta, you ask the same questions of your own pipeline, starting in a Salesforce sandbox.
One e-mail is enough. No form, no sign-up.
Which questions do CROs ask?
The same questions come up before the forecast call and in the sales QBR. Five can be answered with metrics from your own opportunities.
What does the pipeline let us expect, and how has the forecast held up?
The sum of open deals is not an expected value. bEFV, the structural expected value, multiplies each opportunity's amount by its stage win rate from your own history. rEFV, the risk-adjusted revenue expectation, weights bEFV by SLA Health, with measured factors per band. rEFV is an expected value, not a floor.
An SLA value is the time target of a stage; what is compared is the deal's total age. Your organisation sets two of these values per stage and opportunity type. SLA Health classifies each open opportunity as HEALTHY, DELAYED or STALLED by total age against these values.
cEFV, the calibrated revenue forecast, refers to the end of the period. It is the best case of the forecast range, not the realistic case. cEFV is calculated by the optional add-on Funnel Economics Strategist. Strategist is designed to give a forecast for the executive level as a range of three named cases; in the running quarter, as three standings.
EFV Ratio as the check of forecast against result compares actual Closed Won revenue with the rEFV at the start of the period. It says how well the forecast was calibrated, nothing about attainment; it can stand beside a missed plan. A single value says little; the article on Forecast Integrity, forecast vs actual in sales describes the check against plan and result as a series across periods.
Does the pipeline cover the gap to target?
Coverage belongs on the table as a pair. Nominal coverage divides the open pipeline by the gap to target. The Health-Adjusted Coverage Ratio (HACR) puts rEFV in the place of the open pipeline. The finding is the distance between the two values.
A low HACR has two opposite causes. Beside high nominal coverage, the pipeline is there but carries little expected value. Beside low nominal coverage, pipeline is missing. One number alone cannot tell the two cases apart.
HACR has no fixed target value and cannot be added or averaged across levels.
If the open pipeline's amount rises over several periods while rEFV falls, the pattern is Strategic Decoupling, when the pipeline grows and its expected value falls. EFV Density, a term of the method for pipeline quality, sets rEFV in relation to the amount of the open pipeline at the end of the period. No tool reports EFV Density.
Who carries the revenue, and is the team enough?
CIF, the share of the team's result, measures a sales rep's share of the deals won and the revenue won by the team in one period. PAS as a combined measure multiplies a sales rep's win rate across all their decided deals by their CIF. The decided-row win rate is the share of deals won among the deals decided.
Both metrics look back, calculated on decided deals. Whether a rep can still close the remaining gap is a second question, put to the rep's open pipeline, not to what has been won.
Where does the handoff from marketing to sales stick?
Between marketing and sales lie handoff stages. The health band of a deal standing there is a statement about its total age, not about standstill in this stage. How to check the handoff is described in the article on where leads get stuck between marketing and sales.
Where are deals too old, where are stages too slow, and where do deals drop out?
The health band asks whether a deal is old for its stage, measured by total age.
BPV, the deviation from the SLA per stage, asks whether a stage is slow. It measures, per stage, by what percentage the time opportunities spend in the stage deviates from its SLA value.
When the share of the DELAYED and STALLED bands rises against the funnel's own history, the pattern is funnel calcification, when the conspicuous health bands grow.
When the stage win rate of a stage falls, the location matters. A drop across the majority of teams and regions, not a local one, is global stage attrition, when the stage win rate drops across most teams.
Which metrics matter for CROs?
| Metric | Answers the question | More |
|---|---|---|
| rEFV | What can be expected once SLA Health is factored in? | rEFV in the glossary |
| cEFV | What is the best case for the end of the period? | cEFV in the glossary |
| EFV Ratio | How did the revenue won relate to the rEFV at the start of the period? | EFV Ratio in the glossary |
| EVL | How large is the distance between bEFV and rEFV? | EVL in the glossary |
| BPV | In which stage is the time spent above the SLA value? | BPV in the glossary |
| PAS | How do a sales rep's win rate and contribution stand together? | PAS in the glossary |
| CIF | What share of the team's result does a sales rep carry? | CIF in the glossary |
CROs steer with numbers from their own opportunities: what the pipeline lets them expect, whether it covers the gap, where deals are too old and who carries the revenue.
How to get started
Funnel Economics is entering its beta phase. During the beta, you start by running it against a Salesforce sandbox.
Funnel Economics Core is a managed package that runs in your Salesforce org. The prerequisite is Salesforce Enterprise Edition; Data Cloud is not required. There, Core calculates bEFV and a simplified rEFV by health status.
Core ships with dashboards for the executive level. They show target attainment. For dashboard commentary, Core can call a language model. This AI data transfer is off by default and is enabled per org and per user; the package masks personal values before the call.
Funnel Economics Strategist is an optional add-on and not active by default. Strategist requires a per-user authorisation that your Salesforce administrator controls and can revoke. The prepared context then passes through a service we operate to the language model you have chosen, with the names of sales reps and opportunities and record links.
The language model processes the data under your own agreement with the provider. We strongly recommend securing the use of Strategist with an enterprise agreement with that provider, including a data-processing agreement that excludes the use of the data for training. That is a recommendation, not a precondition.
For CROs, Strategist is designed to direct attention to the interfaces between stages and between marketing and sales, and to propose concrete measures.
Discover is meant for trying Funnel Economics before any installation. It is built on a demo org.
What it looks like in the dashboard
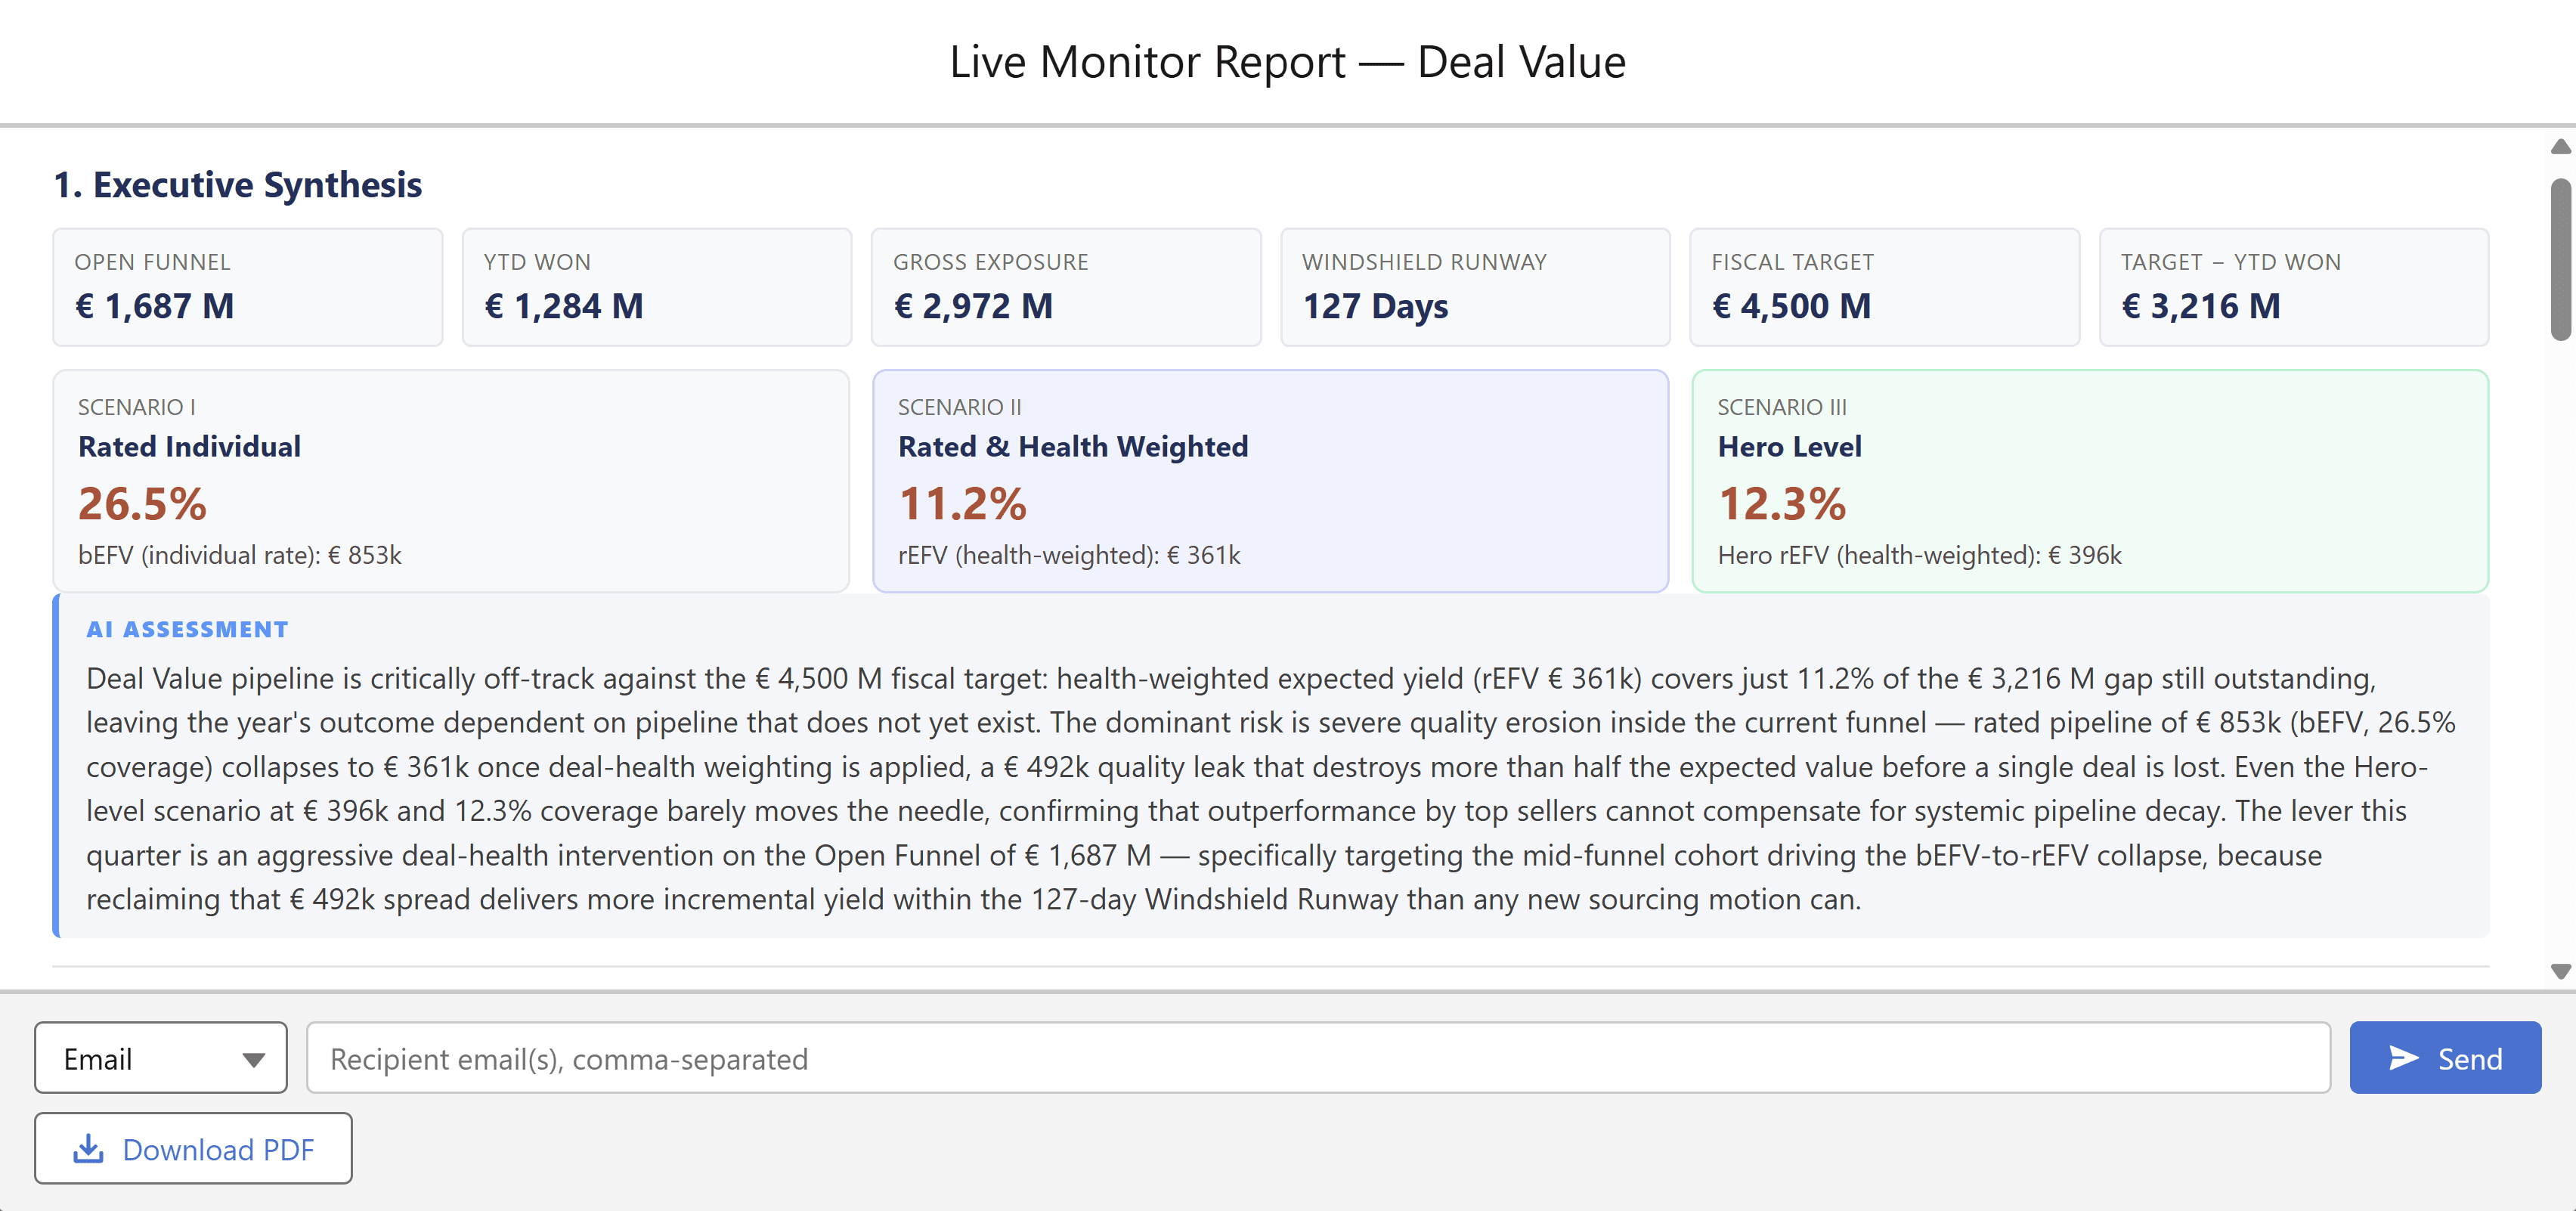
The screenshot shows an anonymised example of the Funnel Economics dashboards. This page only describes how to read the metrics in your role.
Related terms
FAQ
Which metrics does a pipeline review need?
That depends on the question. For the revenue to expect, they are rEFV and cEFV (the best case); for the check against the result, EFV Ratio. Nominal coverage and the Health-Adjusted Coverage Ratio (HACR) show as a pair whether the pipeline covers the gap to target. The health band shows whether a deal is old for its stage, BPV whether a stage is slow. EVL shows how far bEFV and rEFV lie apart. CIF and PAS show who carries the revenue. Each metric is read against its own history.
Is pipeline coverage enough to close the gap to target?
Only a pair of values shows that. Nominal coverage divides the open pipeline by the gap to target. The Health-Adjusted Coverage Ratio (HACR) puts rEFV, the risk-adjusted revenue expectation, in the place of the open pipeline. The finding is the distance between the two values. A low HACR beside high nominal coverage means the pipeline is there but carries little expected value. Beside low nominal coverage, pipeline is missing. There is no fixed target value for HACR.
Do I get a single forecast number?
The forecast range consists of three named cases: worst case, realistic case and best case. Each case stands for an assumption about the business, not for a confidence bound. cEFV, the calibrated revenue forecast for the end of a period, is the best case. It is calculated by the optional add-on Funnel Economics Strategist. The running quarter gets three standings: won so far, expected (an upper bound) and the bound of today's stock – everything open today won, no absolute ceiling.
How can I tell which sales reps can still close the gap?
Not from the look back alone. CIF and PAS are calculated on decided deals. CIF measures a sales rep's share of the deals won and the revenue won by the team. PAS multiplies the rep's win rate across all their decided deals by their CIF. Both show what has been won. Whether someone can still close the remaining gap is a second question. It is put to that sales rep's open pipeline. A rep who leads on the look back can still miss the gap.
Where does Funnel Economics Core calculate, and what leaves Salesforce in the process?
Funnel Economics Core calculates in your Salesforce org. For dashboard commentary, Core can call a language model. This AI data transfer is off by default and is enabled per org and per user; the package masks personal values before the call.
What leaves Salesforce when Strategist is active?
Funnel Economics Strategist is an optional add-on. The prepared context passes through a service we operate to your chosen language model. Rep names, opportunity names and record links go along by design: an answer with placeholders would be useless. Our leg requires a data-processing agreement, which we are preparing. The language model processes the data under your agreement with its provider. There we strongly recommend an enterprise agreement with a data-processing agreement that excludes training use; a recommendation, not a precondition. Your Salesforce administrator controls and can revoke per-user authorisation.
What does Core calculate, and what does Strategist calculate?
Funnel Economics Core calculates bEFV and a simplified rEFV by health status in your Salesforce org and shows both in the dashboards. Funnel Economics Strategist calculates rEFV with measured factors per health band; further figures such as cEFV build on that. Strategist also calculates BPV.